Pre-Game Prediction Model
Our model predicts the home team's chance of winning each game. It was trained on NHL games from the 2017-2018 to 2023-2024 seasons, learning what the most important factors are to winning games in the future. Our Power Rankings are based entirely from this win prediction model.
The model was rebuilt in January 2025 and has major changes from the previous version:
- • Improved Explainability: The model is now divided into three components: each team’s "ability to win", "scoring chances", and "goaltending". These components are displayed on the Power Rankings page. Each component is added together to get a team's overall strength.
- • Less emphasis on recent games: While recent games still carry more weight than older ones, their influence has been reduced. This change prevents the model from overreacting to exceptional performances or slumps in a team’s most recent games.
- • More emphasis on goaltending: Goaltending now accounts for 29% of the model’s influence. 17% is given to a team's ability to win and 54% to scoring chances.
- • Shooting talent adjusted expected goals: Unlike the previous version, which treated all expected goals equally, the new model adjusts for shooting talent. This means players with a proven ability to convert scoring opportunities are given more credit. Read more about shoot talent adjusted goals here.
Compontents of the Models:
-
• Ability To Win: Based only on the team's win percentage in the season so far, with more influence given to recent games. Games that went to overtime or a shootout are considered as ties.
-
• Scoring Chances: Focused on how many opportunities the team gets vs. gives up to their opponents. Driven primarily by shooting talent adjusted expected goals, actual goals, shot attempts, shots on goal, and defensive zone giveaways. Metrics are calculated separately for all man power situations. Recent games are given slightly more weighting.
-
• Goaltending: Based on the performance of each team’s current goalies over their past several seasons, with a stronger emphasis on recent play. Goals saved above expected per 60 minutes played and save percentage are the largest factors. How often the goalie has gotten pulled in recent games is also a factor. Each goalie’s contribution to the team’s overall goaltending rating is proportional to their share of games played.
-
• Home/Away + Rest: While not a factor in the power rankings, for individual games home ice advatange and rest are factored in. Home teams win ~54% of NHL games, partially driven by refereeing bias towards the home team. Also, having played the day before when the other team didn't can decrease a team's chances of winning by ~4%.
Playoff Probabilities and Season Simulator
By running a simulation of the rest of the NHL season 100,000 times we can create precise probabilities of the outcome of the season
for each team. Each game is simulated using the probabilities from the pre-game prediction model discussed below. For games further into the future,
the model scores are regressed to the mean to account for uncertainty.
Starting Goalie Prediction Model
This model predicts the probability of each goaltender on a team's roster starting each of the team's upcoming games over the next few days. The model was trained on data from the 2017-2018 to 2024-2025 seasons, excluding covid impacted time periods. The most likely starting goalie is shown on the MoneyPuck.com homepage for each game. In each game preview you can see the probability of each goalie starting. Once a starting goalie has been identified by the media, that goalie is then shown instead with a link to the source.
Main Variables In Starting Goalie Prediction Model:
1.) Number of days rest for the goalie
2.) Whether the goalie won or lost their last game played
3.) The percentage of the team's last 10 games where the goalie played the full game
4.) Goalie's playing time over the past 3 seasons
5.) Goalie's age (Younger goalies are more likely to play, all else equal)
6.) The goalie's goals saved above expected over the past 2 years
7.) The goalie's save percentage over the past 2 years
8.) If the game is a home or away. (Better goalies are more likely to start home than away games)
9.) The number of goalies on the team. (Sometimes teams have 3 healthy goalies on their roster)
10.) How important the game is for the team in terms of playoff or Cup odds. (Better goalies more likely to start big games)
Expected Goals Model
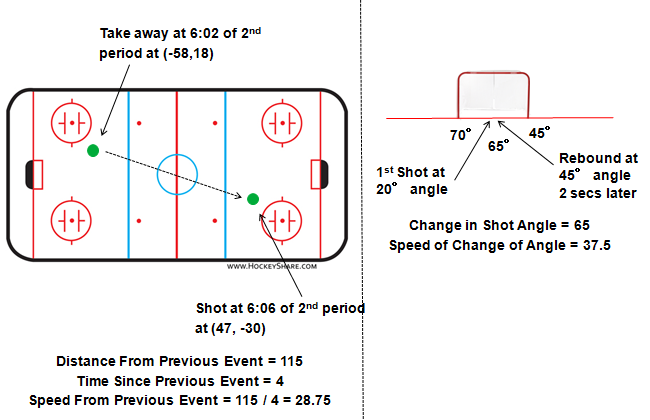
This model predicts the probability of each shot being a goal. Factors such as the distance from the net, angle of the shot, type of shot, and what happened before the shot are key factors in the model. This model was built on over 50,000 goals and 800,000 shots in NHL regular season and playoff games from the 2007-2008 to 2014-2015 season with location data. By adding up all the probabilities of a team's shots during a game, we can calculate the team's expected goals in that game. The model was built using gradient boosting. The MoneyPuck expected goals model does not explicitly use variables for rebounds or rush shots. Rather, it looks at the 'speed' between events: The distance on the ice between the shot and the event before it divided by the amount of time that's elapsed. Also,for rebound shots the model looks at the change in angle between the shots divided by the amount of time between the two shots. The illustrations below describe how the speed variables are created:
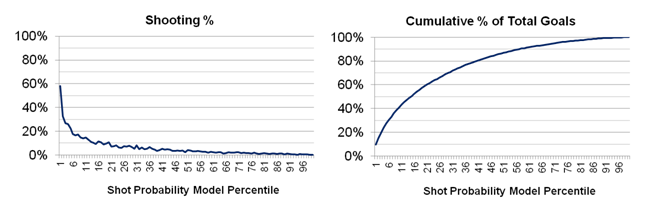
By using the 2015-2016 season as a test to see if the model works, the 15% of shots the model rated the highest contributed to over 50% of the goals that season:
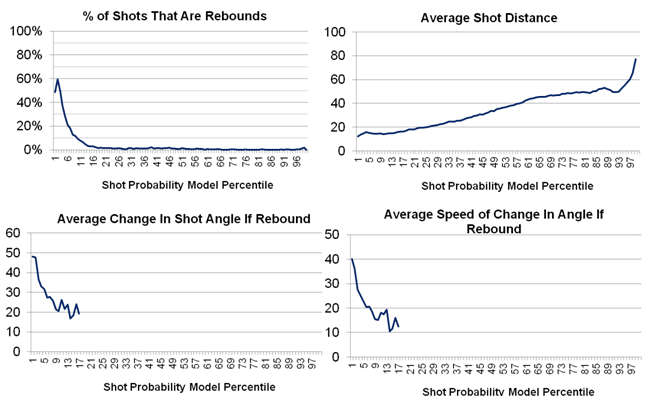
In general, the shots with the highest goal probability are quick rebounds shots close to the net where there has been a large change in shot angle from the original shot:
Variables In Shot Prediction Model:
1.) Shot Distance From Net
2.) Time Since Last Game Event
3.) Shot Type (Slap, Wrist, Backhand, etc)
4.) Speed From Previous Event
5.) Shot Angle
6.) East-West Location on Ice of Last Event Before the Shot
7.) If Rebound, difference in shot angle divided by time since last shot
8.) Last Event That Happened Before the Shot (Faceoff, Hit, etc)
9.) Other team's # of skaters on ice
10.) East-West Location on Ice of Shot
11.) Man Advantage Situation
12.) Time since current Powerplay started
13.) Distance From Previous Event
14.) North-South Location on Ice of Shot
15.) Shooting on Empty Net
Flurry Adjusted Expected Goals
Flurry adjusted expected goals is a statistic that discounts the expected goal value of the 2nd, 3rd, 4th, etc shots in a flurry of shots.
These shots are discounted because they only had the opportunity to occur because the team did not score on a previous shot. Otherwise the puck would be back at center ice.
This concept was discussed in a presentation at the Vancouver Hockey Analytics conference.
Flurry adjusted expected goals have been found to be more repeatable and also more predictive of future winning than regular expected goals.
The definition of a flurry adjusted expected goal is:
Flurry Adjusted Expected Goal Value = Chance of Not Scoring in Flurry Yet * Regular Expected Goal Value of Shot
Here's a video below using an example from the Boston Bruins vs. Ottawa Senators game on March 6th, 2017.
On the first shot Bruins have a 33% chance of scoring. That means there's a 67% chance of having not scored after the first shot. The rebound shot has an 82%
chance of being a goal, thanks to it being a 77° change in direction from the 1st shot.
For the rebound shot, the
expected goal value of it is multiplied by 0.67 to get its adjusted expected goal value. Instead of being worth 0.82 expected goals, the rebound shot is worth
0.55 expected goals. The flurry adjusted expected goal value of the whole flurry is 0.88 instead of 1.15 for regular expected goals. The flurry adjusted metric
has the nice attribute of it not being possible to have more than 1.0 flurry adjusted expected goals in one flurry. This video is also an example of the limitations of expected goals,
as the slap shot was recorded to be closer to the net than it actually was, increasing its expected goal value.
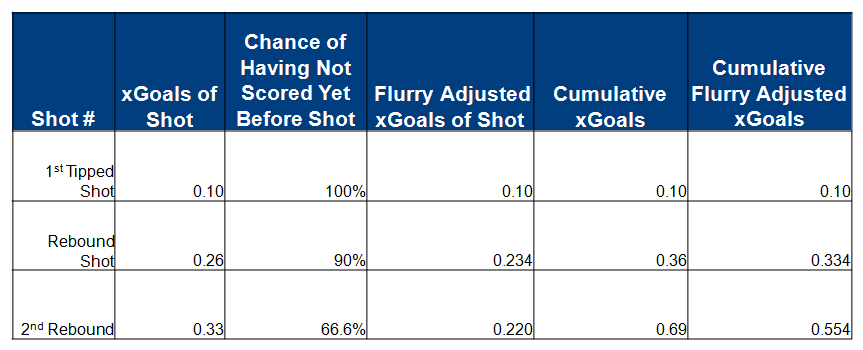
Here's another example from the Dallas Stars vs. Washington Capitals game on March 6th, 2017.
Dallas has three shots in one flurry. While the total expected goals was 0.69, the flurry adjusted total expected goals was 0.554.
This table below explains how the total flurry adjusted expected goals was calculated for the shot flurry from the Stars game.
Shooting Talent Adjusted Expected Goals
While the expected goals model does not factor in a player's shooting skill, we know that some players are better shooters than others.
By using bayesian statistics, we can estimate the shooting skill of snipers like Patrick Laine.
The problem we are trying to solve is "What is the probability that a player is actually a certain shooting talent level given their performance in the NHL so far?". As there is a lot of luck involved in whether a shot goes in the net or not, a player may get more or less goals over the course of a season than their true shooting talent would reflect.
For a mathematical example: the probability that a shooter is actually a 10% above average talent shooter given their goals exceeds their expected goals by 20% over 1,000 career shots =
The percent of skaters with 1,000 career shots so far with historically turn out to be 10% above average shooters during their career multiplied by
the chance a truly 10% above expected shooter talent would have exceed their expected goals by 20% over the course of 1,000 random shots divided by
the percent of players who have taken 1,000 shots that have 10% goals above expected.
Deserve To Win O'Meter
The "Deserve To Win O'Meter" is a feature on our live game pages which shows
the each team's chance of winning the game had the game been re-enacted, except with average goaltending for both teams.
The meter works by simulatating all of the individual expected goals that occured in the game. For example,
consider the scenario where the home team has taken one shot worth 0.5 expected goals and the away team has taken one shot worth 0.1 expected goals.
There are four different possible outcomes to the game as described by the table below:
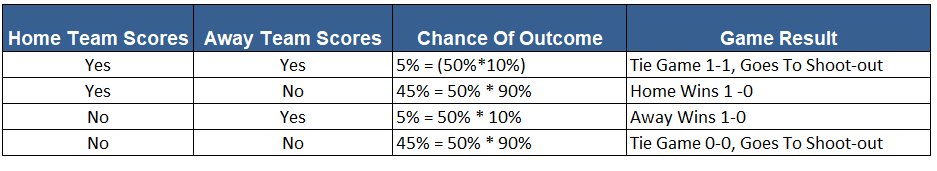
There is a 45% chance the home team wins in regulation. There is also a 50% chance the game goes to a shoot-out, where the home team would be a 50% toss-up to win.
Overall the home team has a 70% chance of winning. (45% of a win in regulation + 25% chance of winning the game in a shootout). The "Deserve To Win O'Meter" would
show 70% for the home team.
The "Deserve To Win O'Meter" was inspired by Namita Nandakumar's brain-teaser on expected goal scenarios.
Expected goals in flurries of shots are treated differently for the Deserve To Win O'Meter. If a shot during a flurry is a "goal" in the simulation, then the later shots in the flurry are excluded from the simulation.
This is for the same reason as why the concept of Flurry Adjusted Expected Goals exist in the first place. Also, empty net shots are also excluded in the simulation, unless the score in the simulation would also likely result in a goalie pull situation, such as a one goal game with a few minutes left.
Since the meter is simulating the game many times, it also shows the luck involved in hockey. In the first 100 simulations the 'Deserve To Win' metric will swing widely, before stabilizing at a specific percentage.
While the Meter is not meant to be a prediction of who will actually win the game, teams that finish the game at above 50% on the meter have historically won 64% of games.
Expected Rebounds and 'Created' Expected Goals
Just as every shot has an expected goal value, it can also have an expected rebound value. This is the probability that the shot will generate a rebound. Rebounds are modeled in
the same way expected goals are using the same variables. If a goalie gives up more rebounds than this model predicts, it may be a sign that the goalie has poor rebound control or that
goalie plays for a team that struggles clearing out the front of the net.
We can also calculate the expected goals that are likely to come from a rebound of a shot. This metric is called 'expected goals of expected rebounds' (xGoals of xRebounds).
The rebound shot does not need to be taken by the same player. In fact, the rebound does not need to actually even occur. The shot just needs to have attributes that are more likely
to generate a rebound. As there is a lot of luck in getting a rebound or not, this metric credits players who have shots that are likely to produce rebounds in general.
Expected Goals Of Expected Rebounds = Probability of the Shot Generating a Rebound * The Expected Goals of The Possible Rebound Shot
Some shots actually have a higher xGoals of xRebounds than the xGoals of the shot itself. These are usually shots that occur far from the net by defensemen.
By combining xGoals from non-rebound shots and xGoals of xRebounds, we can create a metric called 'Created Expected Goals'. This metric attempts to give credit to the
player who does the work generating the xGoals. Compared to the xGoals metric, it punishes players who just feed on the rebounds of other's shots. Defensemen tend to do better in
this metric than xGoals, while some centres often due worse. While we cannot accurately always assign credit for 'creating' an xGoal, this metric tries to make it more fair than
just giving all the credit to the shooter. xGoals from rebounds are given no direct credit in this metric. Rather, credit is given to players who take shots that are likely to generate juicy rebounds.
Created Expected Goals = xGoals of Non-Rebound Shots + xGoals of xRebounds
Live In-Game Model
The in-game model is driven primarily off of the current score and time left. By looking at outcomes of historical games based off of score and time left, we can create probabilities for tied, one goal, two goal, three goal, and 4+ goal difference situations for any amount of time left in games. When a penalty happens the model calculates the win probability of each team if goal(s) are scored on the power play or not and then weights those probabilities by the chance of them happening. The pregame model is also used to calculate the win probability. At the start of the game, the pregame model is influential but gradually is weighted less as the game goes on. In the previous version of the model, the teams' performance during the game (like scoring chances that didn't result in a goal) were factored into the in-game prediction. However, this data did not add significant additional value over the new pre-game model and was removed.
By leveraging the season simulations in the event of each of a regulation win, regulation loss, OT loss or OT win, we can see the impact of playoff odds in real time as the odds of different outcomes
of the game change.
So does the model actually work?
For the 2024-2025 regular season, the team the pre-game model had as the favorite won 60.4% of games. The model's log loss was 0.658.
For the 2023-2024 regular season, the team the pre-game model had as the favorite won 61.1% of games. The model's log loss was 0.661.
For the 2022-2023 regular season, the team the pre-game model had as the favorite won 60.6% of games. The model's log loss was 0.656.
For the 2021-2022 regular season, the team the pre-game model had as the favorite won 64.1% of games. The model's log loss was 0.648.
For the 2020-2021 regular season, the team the pre-game model had as the favorite won 60.1% of games. The model's log loss was 0.6596.
Contributors
MoneyPuck was created by Peter Tanner using mostly Python and is run on AWS. He can be contacted at [email protected], @pr_tanner, or at peter-tanner.com which has more research and analytics. The MoneyPuck.com Twitter account can be followed at @MoneyPuckdotcom
Main Variables In Starting Goalie Prediction Model:
1.) Number of days rest for the goalie
2.) Whether the goalie won or lost their last game played
3.) The percentage of the team's last 10 games where the goalie played the full game
4.) Goalie's playing time over the past 3 seasons
5.) Goalie's age (Younger goalies are more likely to play, all else equal)
6.) The goalie's goals saved above expected over the past 2 years
7.) The goalie's save percentage over the past 2 years
8.) If the game is a home or away. (Better goalies are more likely to start home than away games)
9.) The number of goalies on the team. (Sometimes teams have 3 healthy goalies on their roster)
10.) How important the game is for the team in terms of playoff or Cup odds. (Better goalies more likely to start big games)
By using the 2015-2016 season as a test to see if the model works, the 15% of shots the model rated the highest contributed to over 50% of the goals that season:
In general, the shots with the highest goal probability are quick rebounds shots close to the net where there has been a large change in shot angle from the original shot:
Variables In Shot Prediction Model:
1.) Shot Distance From Net
2.) Time Since Last Game Event
3.) Shot Type (Slap, Wrist, Backhand, etc)
4.) Speed From Previous Event
5.) Shot Angle
6.) East-West Location on Ice of Last Event Before the Shot
7.) If Rebound, difference in shot angle divided by time since last shot
8.) Last Event That Happened Before the Shot (Faceoff, Hit, etc)
9.) Other team's # of skaters on ice
10.) East-West Location on Ice of Shot
11.) Man Advantage Situation
12.) Time since current Powerplay started
13.) Distance From Previous Event
14.) North-South Location on Ice of Shot
15.) Shooting on Empty Net
The definition of a flurry adjusted expected goal is:
Flurry Adjusted Expected Goal Value = Chance of Not Scoring in Flurry Yet * Regular Expected Goal Value of Shot
Here's a video below using an example from the Boston Bruins vs. Ottawa Senators game on March 6th, 2017. On the first shot Bruins have a 33% chance of scoring. That means there's a 67% chance of having not scored after the first shot. The rebound shot has an 82% chance of being a goal, thanks to it being a 77° change in direction from the 1st shot. For the rebound shot, the expected goal value of it is multiplied by 0.67 to get its adjusted expected goal value. Instead of being worth 0.82 expected goals, the rebound shot is worth 0.55 expected goals. The flurry adjusted expected goal value of the whole flurry is 0.88 instead of 1.15 for regular expected goals. The flurry adjusted metric has the nice attribute of it not being possible to have more than 1.0 flurry adjusted expected goals in one flurry. This video is also an example of the limitations of expected goals, as the slap shot was recorded to be closer to the net than it actually was, increasing its expected goal value.
For a mathematical example: the probability that a shooter is actually a 10% above average talent shooter given their goals exceeds their expected goals by 20% over 1,000 career shots = The percent of skaters with 1,000 career shots so far with historically turn out to be 10% above average shooters during their career multiplied by the chance a truly 10% above expected shooter talent would have exceed their expected goals by 20% over the course of 1,000 random shots divided by the percent of players who have taken 1,000 shots that have 10% goals above expected.
There is a 45% chance the home team wins in regulation. There is also a 50% chance the game goes to a shoot-out, where the home team would be a 50% toss-up to win. Overall the home team has a 70% chance of winning. (45% of a win in regulation + 25% chance of winning the game in a shootout). The "Deserve To Win O'Meter" would show 70% for the home team.
The "Deserve To Win O'Meter" was inspired by Namita Nandakumar's brain-teaser on expected goal scenarios.
Expected goals in flurries of shots are treated differently for the Deserve To Win O'Meter. If a shot during a flurry is a "goal" in the simulation, then the later shots in the flurry are excluded from the simulation. This is for the same reason as why the concept of Flurry Adjusted Expected Goals exist in the first place. Also, empty net shots are also excluded in the simulation, unless the score in the simulation would also likely result in a goalie pull situation, such as a one goal game with a few minutes left.
Since the meter is simulating the game many times, it also shows the luck involved in hockey. In the first 100 simulations the 'Deserve To Win' metric will swing widely, before stabilizing at a specific percentage.
While the Meter is not meant to be a prediction of who will actually win the game, teams that finish the game at above 50% on the meter have historically won 64% of games.
We can also calculate the expected goals that are likely to come from a rebound of a shot. This metric is called 'expected goals of expected rebounds' (xGoals of xRebounds). The rebound shot does not need to be taken by the same player. In fact, the rebound does not need to actually even occur. The shot just needs to have attributes that are more likely to generate a rebound. As there is a lot of luck in getting a rebound or not, this metric credits players who have shots that are likely to produce rebounds in general.
Expected Goals Of Expected Rebounds = Probability of the Shot Generating a Rebound * The Expected Goals of The Possible Rebound Shot
Some shots actually have a higher xGoals of xRebounds than the xGoals of the shot itself. These are usually shots that occur far from the net by defensemen.
By combining xGoals from non-rebound shots and xGoals of xRebounds, we can create a metric called 'Created Expected Goals'. This metric attempts to give credit to the player who does the work generating the xGoals. Compared to the xGoals metric, it punishes players who just feed on the rebounds of other's shots. Defensemen tend to do better in this metric than xGoals, while some centres often due worse. While we cannot accurately always assign credit for 'creating' an xGoal, this metric tries to make it more fair than just giving all the credit to the shooter. xGoals from rebounds are given no direct credit in this metric. Rather, credit is given to players who take shots that are likely to generate juicy rebounds.
Created Expected Goals = xGoals of Non-Rebound Shots + xGoals of xRebounds
By leveraging the season simulations in the event of each of a regulation win, regulation loss, OT loss or OT win, we can see the impact of playoff odds in real time as the odds of different outcomes of the game change.
For the 2023-2024 regular season, the team the pre-game model had as the favorite won 61.1% of games. The model's log loss was 0.661.
For the 2022-2023 regular season, the team the pre-game model had as the favorite won 60.6% of games. The model's log loss was 0.656.
For the 2021-2022 regular season, the team the pre-game model had as the favorite won 64.1% of games. The model's log loss was 0.648.
For the 2020-2021 regular season, the team the pre-game model had as the favorite won 60.1% of games. The model's log loss was 0.6596.